
Status
RadixCharts has closed. Until September 2026 radixcharts.com served a single notice (archived 6 June 2026) saying its "data analytics service for RadixDLT is no longer available", with one link, to the Radix ecosystem directory. On 19 September the domain went dark as well: its registry record had been renewed to 18 September 2027 and set to clientHold, a status that takes a domain out of the DNS. Read again on 11 November, the registry record no longer carries the hold; last changed on 30 October, it delegates the domain to Hetzner's nameservers, which refuse to answer for it, so neither radixcharts.com nor www.radixcharts.com returns an address. The documentation site, docs.radixcharts.com, stopped resolving earlier, so the feature descriptions below cite archived copies. The validator the project ran is still registered; Validator below links its current figures.
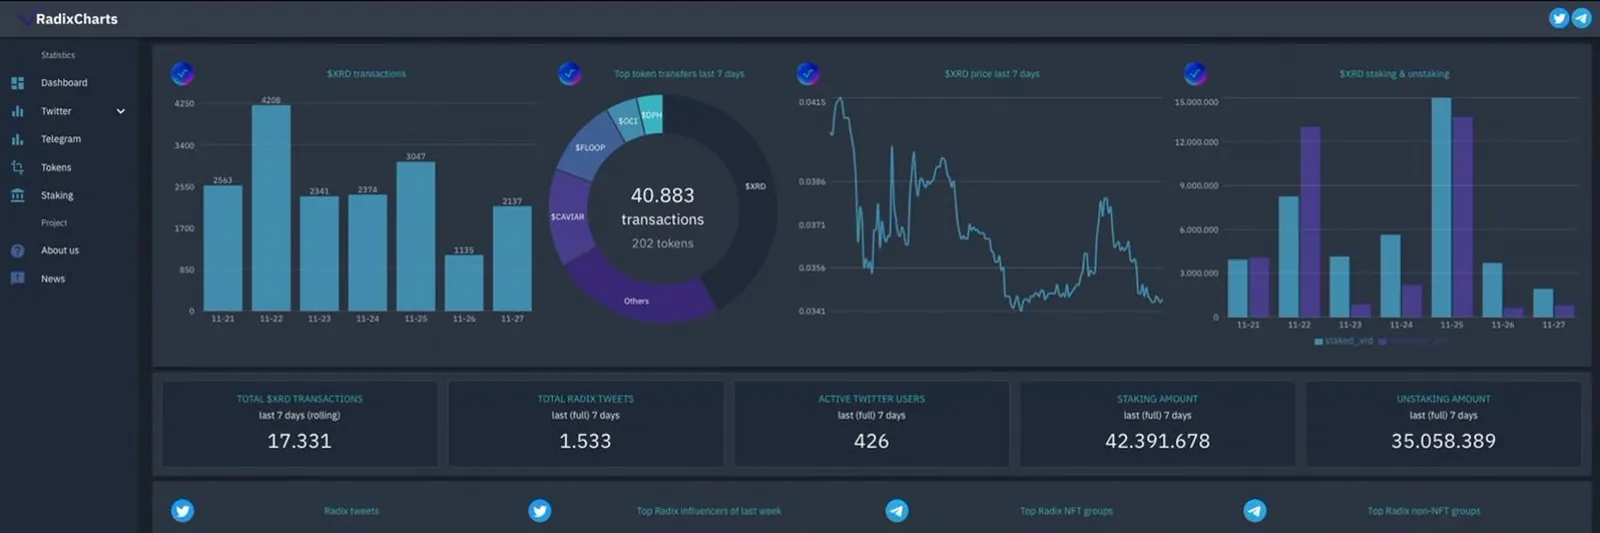
RadixCharts was an analytics platform that provided real-time insights into the Radix ecosystem. Founded in 2022, it offered statistics and data visualizations to help users understand the performance and growth of the Radix network. The platform showed information about token prices, decentralized applications (dApps), transaction volume, staking statistics, and social media presence.
History
The inspiration for RadixCharts came from the Radix community, which manually checked telegram group members to create rankings for NFT projects. Recognizing the need for automation and having a passion for data and statistics, the project was initiated in September 2022. Since its inception, RadixCharts' services have expanded considerably.
Features
- Total Value Locked (TVL): One of the primary metrics provided by RadixCharts is the Total Value Locked in the Radix network. TVL is a crucial indicator of the network's health and the trust users have in it.
- $TOP Token: The $TOP token is utilized as an incentive for Radix influencers. It has a limited supply of 11,000 to maintain its exclusivity.
- Validator Insights: RadixCharts offers detailed information on network validators. This feature is essential for those interested in staking their $XRD. It provides intricate data on each validator's performance, uptime, and other critical statistics.
Team
RadixCharts was founded by Nelly Sayon.
Achievements and Recognition
- Scrypto Portfolio Challenge (September 2022): Nelly, the founder of RadixCharts, participated in the Scrypto Challenge, focusing on portfolio management and yield farming. After a few weeks of learning Scrypto, she submitted her project, "Juicy Yields," and received an honorable mention for her blueprint.
- Dandelion Program Grant (January 2023): The Radix Ecosystem Metrics page on RadixCharts was developed as a result of a Dandelion Program grant. This initiative by RDX Works rewarded individuals with innovative marketing ideas. RadixCharts contributed by offering transparent, real-time visualizations of economic activities on the Radix platform, shedding light on the health and growth of the Radix ecosystem.
- Developer Incentive (September 2023): Nelly, the founder, was awarded US$1,500 of $XRD as part of the Scrypto Developer Incentive program. The RDX Works team recognized her contributions to RadixCharts, which has become an integral tool for data retrieval and visualization.
Partnerships
- RadixScan: RadixCharts collaborates with RadixScan, a community explorer for the Radix network. RadixScan offers tools and extensive information on network activity, validators, tokens, and more.
Validator
RadixCharts funded itself partly through a validator, Radix Charts V2, whose Radix Dashboard page carries its current stake and fee. Read from the Radix Gateway on 11 November 2026, it is registered and accepts delegated stake. Its name and description both read "Radix Charts V2" and no longer mention RadixCharts, and its info link points at a page published by the GitHub user jerseyjon. Delegated $XRD is not at risk when a validator misses rounds, because Radix has no slashing; delegators lose the emissions for the epochs it misses.